
Sara’s mom had to tell a story now
Nana often told a story or sing a lullaby to put Sara to sleep. Sometimes, even when a teenager, Sara would insist on it. This time, Nana was away for a few days to visit some relatives. When Sara could not sleep, she went to her Mom and asked her to tell a story that she had never heard before. Mom was not used to it because this was Nana’s job but Sara would not budge. Finally, mom gave in and this is what happened.
Mom: This is an ancient Indian story I read it in a magazine when I was in high school. I don’t know if it is true.
Sara: Tell me already, please even if it is all made up.
Mom: Once upon a time, in India, there was a king who liked unique gifts. One day a man gifted the king with a uniquely designed carpet. I used to love this design and got my dad to make me a photocopy from the magazine. Here it is (Fig. 6.1). I got it from my room when you asked me to tell you a story.
 Sara: Mom, this carpet picture looks like a barcode or something.
Mom: May be it does. The man had used the concept of placement values of numbers in the decimal system, his intellect and the help of a skillful carpet maker. He wrote numbers on the carpet in such a way that there was the same distance between 1 and 10 as between 10 and 100, and between 100 and 1000. This would be a new way to present the numbers. However, the king was so used to the distance between 1 and 2 being the same as between 2 and 3, and a much longer distance between 1 and 10. He simply dismissed the man saying that this would confuse the average person. He did not encourage the man any further but being a kind king he gave him a small reward. The matter ended right there.
This system was reinvented in the sixteenth century in Scotland by a mathematician named John Napier.
Sara: Thanks for the story Mom. Don’t we use the concept of increasing decades every day when we talk about milliliters, centiliters, deciliters and liters?
Sara went to sleep but the next day she told this story to Johnny.
Johnny: Your Mom and Nana tell you good stories. After all your Mom is your Nana’s daughter.
Sara: No, she is not. She is the daughter in law of my Nana. Never mind, you said that you were frustrated yesterday. What happened?
Graphing exponential data
Johnny: Remember the story from your Nana about uncle Shah. The amount of money uncle Shah gave to Nana was the exponential function f(t) = Cinitial x 2t . He had started with one dollar and kept doubling it each year until Nana reached the age of 14. I just wanted to see what the graph of that function would look like. So I tabulated the amounts from the story and then tried to graph them (Fig 6.2 and Fig. 6.3).
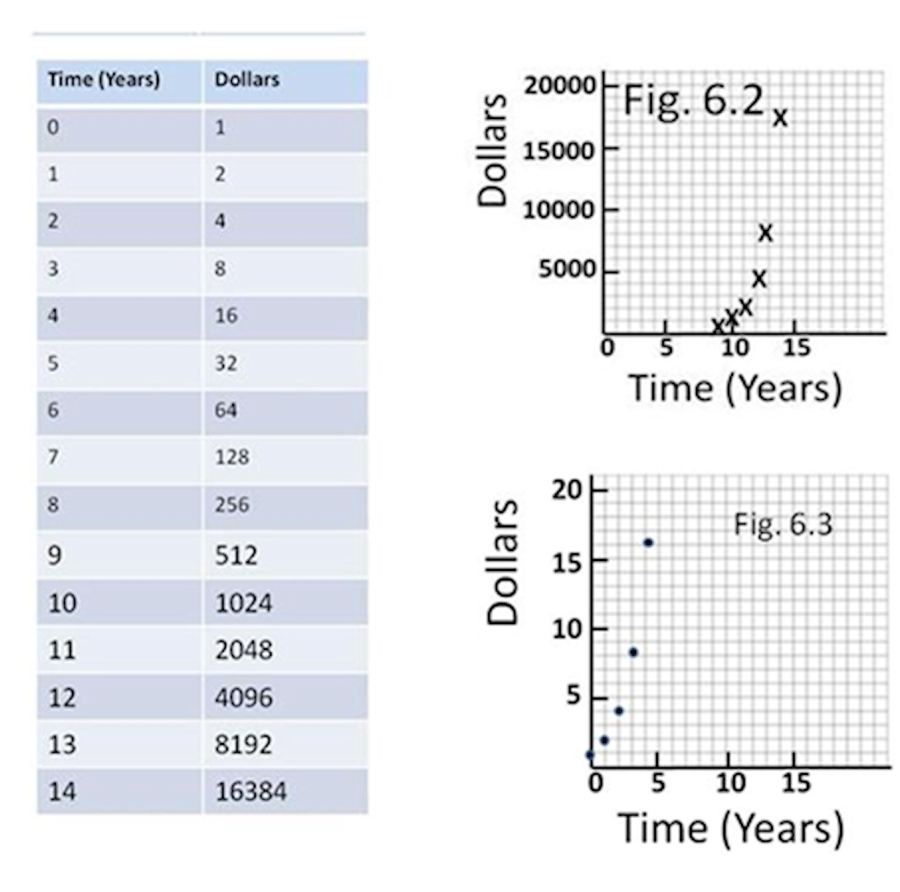 First, I used a normal graph paper and plotted the number of years on the X-axis and the dollar amounts on the Y-axis. I set the X-axis from 0 to 14 and the Y-axis from 0 to 20,000. The points for Y greater than 1000 could be marked easily but it was hard to read where to mark the points for very small values of Y. I changed the Y-scale starting from 0 and ending at 20. Now, I could easily mark the points up to 16 but there was no space for the points with the higher values. I got frustrated thinking that no scale would accommodate all of the points.
Magic graph paper
Sara: Johnny, here is the best part of Mom’s story. She gave me a magic graph paper based on it. This magic paper, Johnny boy, is the prayer to end your graphing frustration. In your graph paper both X- and Y- axes are linear. For example, in yor graph paper, in the Y-axis the distance same between 1000 and 10000 dollars is about 1000 times the distance between 1 and 10 dollars. The magic graph paper is made to show the distance between 1 and 10 to be the same as that between 1000 and 10000. Thus, the distance between every decade is the same. She called it a semilogarithmic paper or a semi-log paper for short. It is semi because one axis is linear just like in the graph paper you were using and the other axis is logarithmic. On this, I started the scale with 1 to 100000 and plotted the data for all the 14 years.
Johnny: That’s neat. Thank your mom from me for that but I have a question, “How do you figure out the distance between one and two dollars?”
Sara: Here the lines are marked but we will have to figure out how they come up with these lines. I have an idea though.
Johnny: I see that you made three graphs.
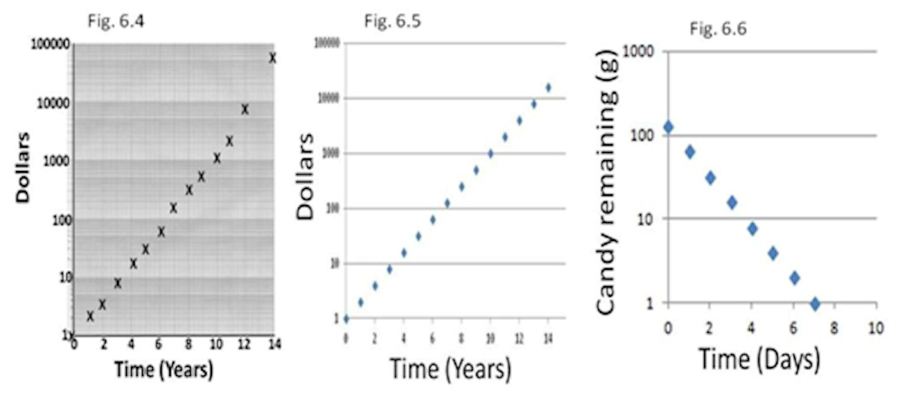
Sara: Yes, the first one I did by hand and it is a little messy (Fig. 6.4). This is the graph for the money that uncle Shah gave Nana each year until she was 14. Remember, he gave her one dollar when she was born, 2 the next year, 4 the next year and so on until it reached $16384 on year 14. You can see money for all the years in this graph.
Jonnhy: What about the other two graphs?
Sara: Johnny, you have made many graphs using a computer program. I did the same but I noticed that the computer program on my laptop lets you choose the axis type – linear or logarithmic. For X-axis, I chose linear and the Y-axis logarthimic. Then I graphed the same datain Fig.6.5.
Johnny: Wow, these graphs are straight lines with positive slopes. I see the third one has a negative slope (Fig.6.6).
Sara: The third graph is where Ashley had 128 g of candy and she could eat half of the remaining candy on any day. They were both exponential functions but with a rising exponent for one for a falling one for the other. On the semi-log graphs they both come with straight lines but the slope is positive for the rising exponent and negative for where there is a fall.
Johnny: That’s great but I still have my question about how they come up with the lines for 2, 3, 4 and so on.
Sara: We will have to read up on that. I think we have a chapter on logs in our book. Why don’t we do this another time?
Challenge
Tony Gordito, a grade 10 student, was sitting in the school cafeteria with his friends and enjoying the food. Chelsea said that she was going to run in the 5 km race on that weekend to raise money for the Cancer Foundation. Tony said that maybe he should run too. Everybody laughed thinking that Tony could not run. Chelsea asked, “How fast?” Tony countered, “How many minutes do you take for the 5 km run?” Chelsea said, “22 minutes”. Tony declared that he would run next year and beat her 22 minute time. Now that he had made the declaration, “Tony went to the tracks to start the training.” He walked as fast as he could with occasional jogs in between and completed the 5 km in 60 minutes. He figured that he could practice 2-3 days a week and every week he would take 2 percent less time than the previous week. If Tony remains determined to do this, do you think that after 52 weeks, he could meet the challenge of running 5 km in less than Chelsea’s 22 min? Tony told this story to Mrs. Clementine, the Math teacher. She said, “A picture is worth a thousand words. Why don’t you draw your timing every fourth week on a graph paper ? Oh yes, make sure that you draw a proper straight line with a ruler.”
Solution: Tony ran the 5 km in 60 min on the weekend. After each week he will take 2% less time than the previous week. Therefore time after n weeks will be 60 x (1- 0.02)n or 60 x 0.98n. In order to get a straight line, Tony had to plot the 5k run time on a log scale. He got a single cycle semilogarithmic paper and graphed the data as shown. Clearly he beat Chelsea’s time of 22 minutes as shown in the graph with an arrow (Fig. 13.2).

