
Jimboy
Jimboy is a teen rebel who hates it when his father is away to earn a living for the family, and his mother does not let him do anything he wants. His mother, nevertheless reminds him often, how she had to carry him during nine months of the pregnancy. John is never impressed, and says, “I wish I was created in a mechanical uterus so that dad could pay for the machine and we would be done with.” Most mothers and their off springs have better relationships.
Sara had a working mother and it was her grandmother who had practically raised her. A week before the Mother’s Day, she was chatting with her boyfriend Johnny.
Sara: Johnny, I don’t know about Jimboy’s feeling but I think that mothers have won this emotional argument.
Johnny: How so ? Is it because, I buy flowers for my mom on Mother’s Day?
Sara: Our family goes out for a special dinner on Mother’s Day. I give mom a gift, and dad gives a gift to grandma. Here is the key. My grandma did not carry me for nine months but she practically raised me. On Mother’s Day, I give her hugs, flowers and a gift too.
Average expenditure on Mother’s Day
Johnny: How does that mean that mothers have won this emotional fight ? Jimboy does not feel that way.
 Sara: Let’s leave him alone. I read yesterday that in USA the average expenditure on Mother’s Day has been increasing during the last decade. Here is a graph showing that. Although, I did not draw a smooth line connecting the points, it could be a straight line with a positive slope. The next picture shows the data. The average Mother’s Day expenditure per person was $123.89 in 2009 and expected to be $196.47 in 2019. This is a slope of $6.60 per year over these 11 years. On and average, the expenditure on Mother’s Day increased each year by this amount.
Causes of the increase
Johnny: This graph does not mean much. Our family income has also increased over the last decade. Has the income of your mom and dad also not increased ? So the increased expense just reflects this increase in the income and it may be also because of inflation. I know that the number of my friends who do something for this day has not changed. It has stayed at around 80%.
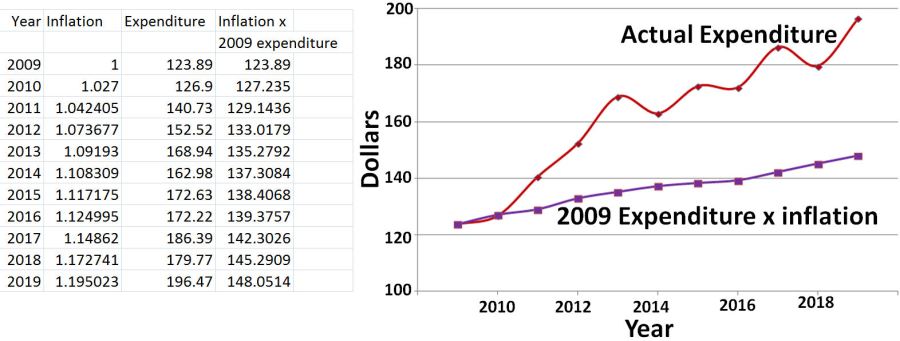 Sara: I also have the inflation data. A change in the consumer price index over time is the inflation. Because we want to compare the years 2009 to 2019, for each year, I divided this index by the 2009 prices. Then I made the model that the average expenditure increased from 2009 onwards only due to inflation. Here is the graph for 2009 expenditure times inflation. You can see that this line is not as steep as the actual change in expenditure. The slope is only $2.2 per year compared to $6.60 per year for the actual expenditure. So the change on Mother’s Day expenditure in USA could not be just due to inflation.
 Johnny: What about the increased incomes ? Didn’t the salaries of both your mom and dad increase from 2009 to 2019 ? Do you have data for average income in USA over these years ?
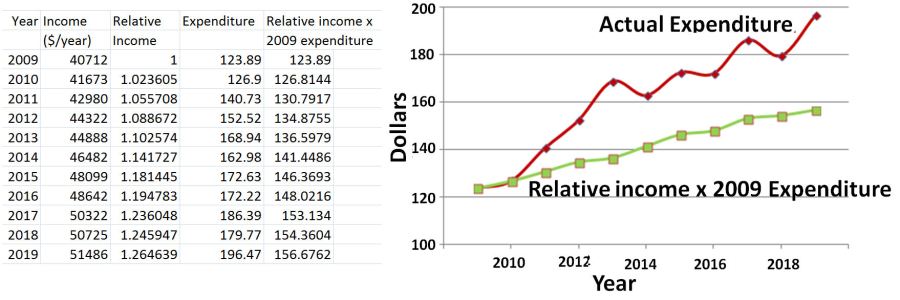
Sara searched on the Internet and said: Here it is. The average incomes increased over these years. Again, we can make a model that the increase in the Mother’s day expenditure was solely due to the change in the relative income. Relative income would be the average income in a given year divided by the average income in 2009. Now multiplying the 2009 expenditure by these numbers gave the green graph above. You can see that it is not as steep as the actual expenditure graph. It has a slope of $2.98/year compared to the $6.60/year for the actual expenditure.
Johnny: I get what you did but I have one problem. We assumed that there is a linear relationship between the expenditure and time. Is it really true ? I thought that it would be exponential.
Sara: We can check it that way too. Here, are the best fit equations
Actual expenditure = 124.751 x 1.043256 (number of years after 2009)
Inflation corrected expenditure = 123.234 x 1.016708(number of years after 2009)
Relative income corrected expenditure = 121.652 x 1.024622(number of years after 2009)
So, the base for the exponential fits shows that the actual expenditure increased faster than inflation or the income corrected expenditure.
Johnny: That means the Mother’s Day expenditure has been really increasing over the last decade whether you use a linear model or an exponential one. The cause for the increase is not inflation or an increase in average income. I guess it must be the increased realization of the importance of this day.
Sara: It could also be increased advertising. We have not examined that possibility.
Challenge
In 2019, the anticipated Mother’s Day expenditure per person in USA was $196.47. For Father’s Day the same number was $138 and for the Valentine’s Day it was $162.
Johnny argues that Mother’s Day expenditure was always high. May be the other two are increasing more rapidly and will catch up. He went to the Internet and got the data shown in this table.
Sara says that for each year you can calculate the ratio of the expenditure on Father’s Day to that of Mother’s Day and see if there is a trend in that ratio. You can also do the same thing for the Valentine’s Day.
| Expenditure in Dollars | |||
| Year | Mother’s Day | Father’s Day | Valentine’s Day |
| 2009 | 123.89 | 81.71242 | 103 |
| 2010 | 126.9 | 85.18954 | 103 |
| 2011 | 140.73 | 96.4902 | 116 |
| 2012 | 152.52 | 110.3987 | 126 |
| 2013 | 168.94 | 115.6144 | 131 |
| 2014 | 162.98 | 108.6601 | 134 |
| 2015 | 172.63 | 110.3987 | 142 |
| 2016 | 172.22 | 124.3072 | 147 |
| 2017 | 186.39 | 134.7386 | 137 |
| 2018 | 179.77 | 133 | 144 |
| 2019 | 196.47 | 138 | 162 |
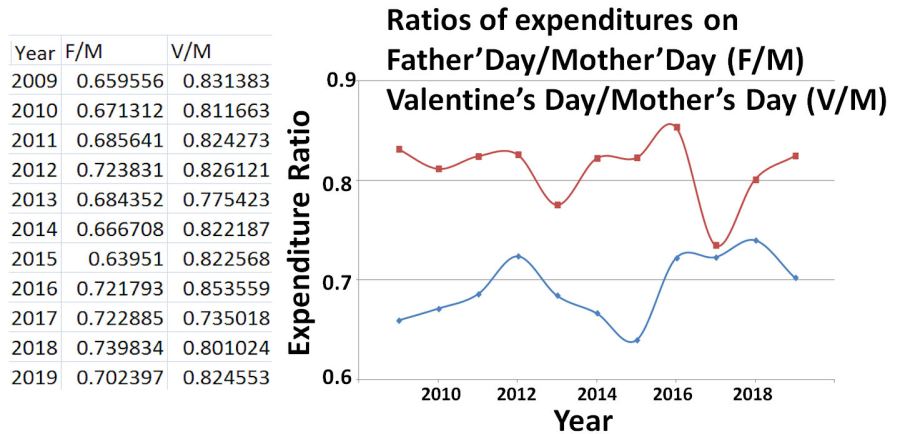 First, calculate the ratio of expenditure (F/M) for each year, and then also V/M.
Graph the two ratios against the years. Blue graph is for the ratio F/M. There is a marginal increase in this ratio from 2009 to 2019. So the increase in the Father’s Day expenditure with respect to the Mother’s Day expenditure may have increased somewhat but the data are all over the place and the slope is not steep enough to say if and when Father’s Day expenditure will catch up with the Mother’s Day expenditure. The red graph shows that the ratio V/M has remained unchanged over the years.
You could have also done the same thing by fitting the original data as shown in the story.
